The Dashboard allows users to quickly view metrics through analytics. This is most commonly used by business level administration.
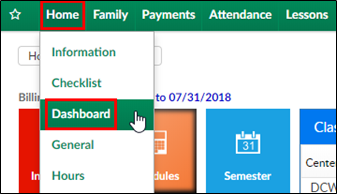
- Click Home from the navigator bar and select Dashboard

- Choose a Metric Type from the drop-down menu
- After choosing the metric type, more search options will appear

- Choose the center
- Select the Current month and year
- Select previous month or year if necessary, but not required
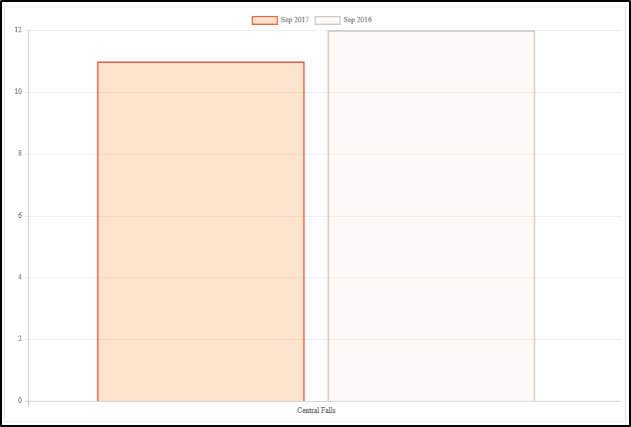
- Click Graph to view a comparison graph of the chosen metric

- Click Report to receive an Excel file of the data


